
Question
Time left
83s per Q
Score
0
What is the answer to this question?
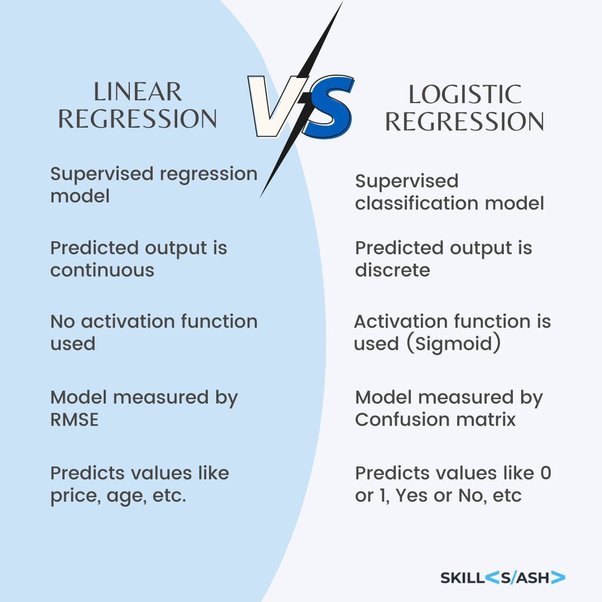
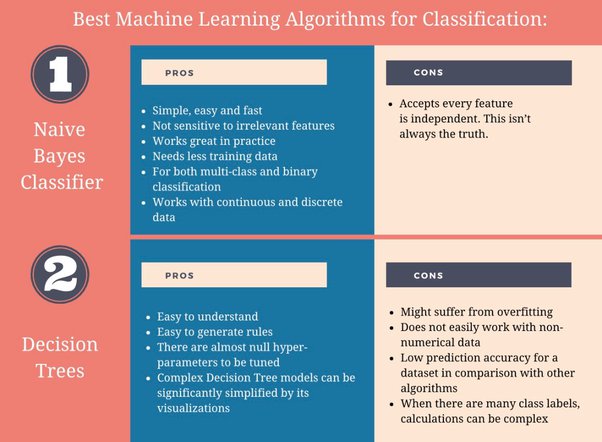
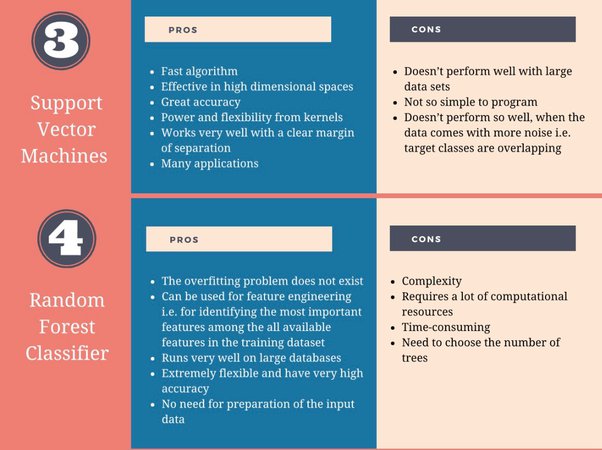
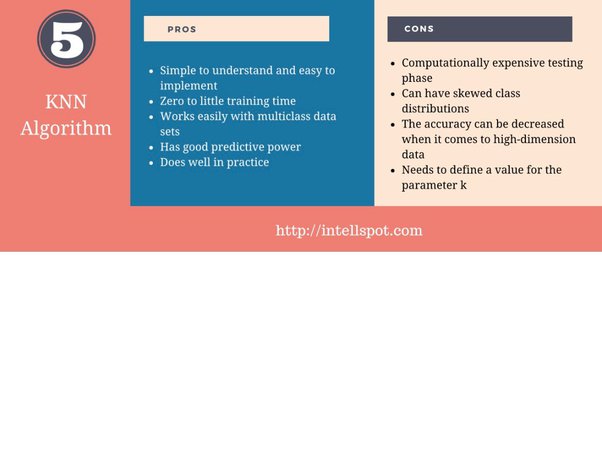
Q2: What are the assumptions required for linear regression?
There are four major assumptions:
- There is a linear relationship between the dependent variables and the regressors, meaning the model you are creating actually fits the data,
- The errors or residuals  of the data are normally distributed and independent from each other,
- There is minimal multicollinearity between explanatory variables, and
- Homoscedasticity. This means the variance around the regression line is the same for all values of the predictor variable.
- Machine Learning
-
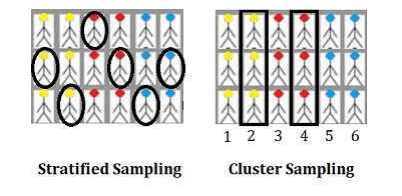
Q3: What is sampling? How many sampling methods do you know?
- Data sampling is a statistical analysis technique used to select, manipulate and analyze a representative subset of data points to identify patterns and trends in the larger data set being examined. It enables data scientists, predictive modelers and other data analysts to work with a small, manageable amount of data about a statistical population to build and run analytical models more quickly, while still producing accurate findings.
- Sampling can be particularly useful with data sets that are too large to efficiently analyze in full – for example, in big Machine Learning applications or surveys. Identifying and analyzing a representative sample is more efficient and cost-effective than surveying the entirety of the data or population.
- An important consideration, though, is the size of the required data sample and the possibility of introducing a sampling error. In some cases, a small sample can reveal the most important information about a data set. In others, using a larger sample can increase the likelihood of accurately representing the data as a whole, even though the increased size of the sample may impede ease of manipulation and interpretation.
- There are many different methods for drawing samples from data; the ideal one depends on the data set and situation. Sampling can be based on probability, an approach that uses random numbers that correspond to points in the data set to ensure that there is no correlation between points chosen for the sample.
- Sampling
- 
Q4: What is a statistical interaction?
- Basically, an interaction is when the effect of one factor (input variable) on the dependent variable (output variable) differs among levels of another factor. When two or more independent variables are involved in a research design, there is more to consider than simply the "main effect" of each of the independent variables (also termed "factors"). That is, the effect of one independent variable on the dependent variable of interest may not be the same at all levels of the other independent variable. Another way to put this is that the effect of one independent variable may depend on the level of the other independent
variable. In order to find an interaction, you must have a factorial design, in which the two (or more) independent variables are "crossed" with one another so that there are observations at every
combination of levels of the two independent variables. EX: stress level and practice to memorize words: together they may have a lower performance.
- Machine Learning: Statistical Interaction
Q5: What is selection bias?
Selection (or ‘sampling’) bias occurs when the sample data that is gathered and prepared for modeling has characteristics that are not representative of the true, future population of cases the model will see.
That is, active selection bias occurs when a subset of the data is systematically (i.e., non-randomly) excluded from analysis.
- Selection bias is a kind of error that occurs when the researcher decides what has to be studied. It is associated with research where the selection of participants is not random. Therefore, some conclusions of the study may not be accurate.
The types of selection bias include:
- Sampling bias: It is a systematic error due to a non-random sample of a population causing some members of the population to be less likely to be included than others resulting in a biased sample.
- Time interval: A trial may be terminated early at an extreme value (often for ethical reasons), but the extreme value is likely to be reached by the variable with the largest variance, even if all variables have a similar mean.
- Data: When specific subsets of data are chosen to support a conclusion or rejection of bad data on arbitrary grounds, instead of according to previously stated or generally agreed criteria.
- Attrition: Attrition bias is a kind of selection bias caused by attrition (loss of participants)
discounting trial subjects/tests that did not run to completion.
- Machine Learning: Selection Bias
-
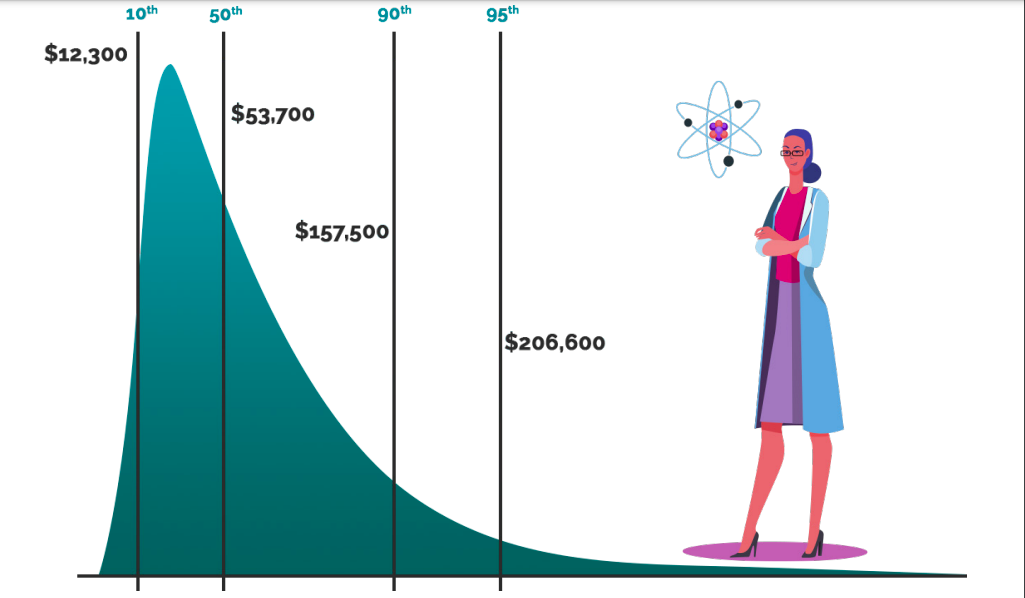
Q6: What is an example of a data set with a non-Gaussian distribution?
- The Gaussian distribution is part of the Exponential family of distributions, but there are a lot more of them, with the same sort of ease of use, in many cases, and if the person doing the machine learning has a solid grounding in statistics, they can be utilized where appropriate.
- Binomial: multiple toss of a coin Bin(n,p): the binomial distribution consists of the probabilities of each of the possible numbers of successes on n trials for independent events that each have a probability of p of
occurring.
- Bernoulli: Bin(1,p) = Be(p)
- Poisson: Pois(λ)
- Machine Learning: data set with a non-Gaussian distribution
- 
Q7: What is bias-variance trade-off?
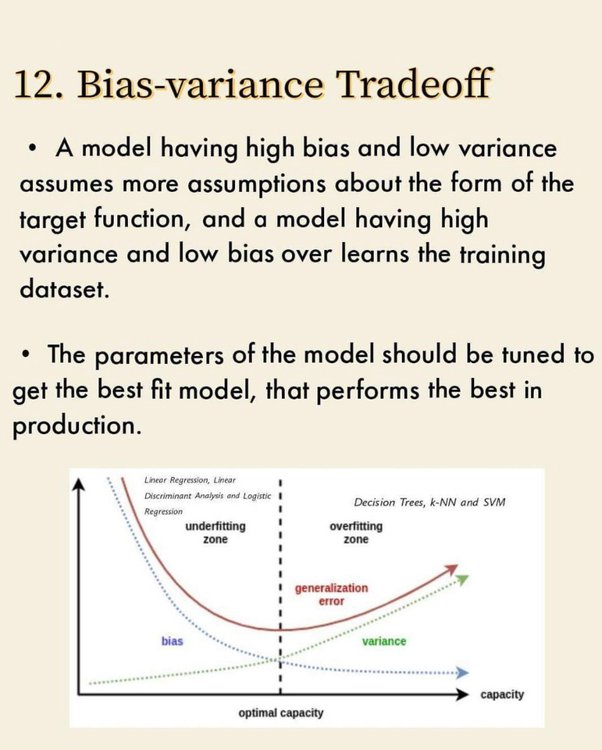
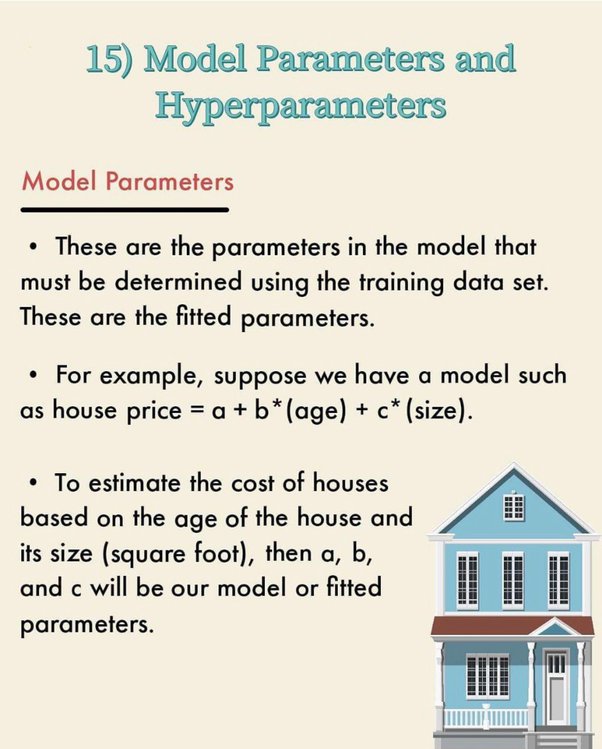
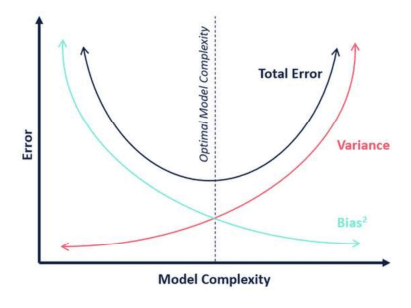
- Bias: Bias is an error introduced in the model due to the oversimplification of the algorithm used (does not fit the data properly). It can lead to under-fitting.
Low bias machine learning algorithms - Decision Trees, k-NN and SVM
High bias machine learning algorithms - Linear Regression, Logistic Regression
- Variance: Variance is error introduced in the model due to a too complex algorithm, it performs very well in the training set but poorly in the test set. It can lead to high sensitivity and overfitting.
Possible high variance – polynomial regression
- Normally, as you increase the complexity of your model, you will see a reduction in error due to lower bias in the model. However, this only happens until a particular point. As you continue to make your model more complex, you end up over-fitting your model and hence your model will start suffering from high variance.
- Bias-Variance trade-off: The goal of any supervised machine learning algorithm is to have low bias and low variance to achieve good prediction performance.
- Machine Learning: What is bias-variance trade-off?
- 
Q9: What is correlation and covariance in statistics?
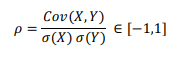
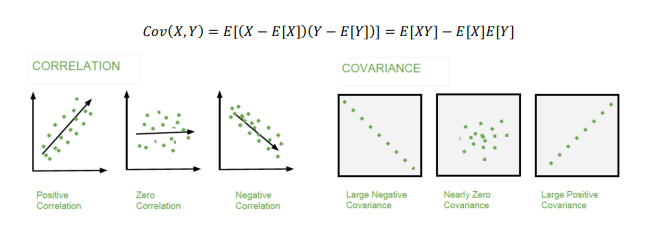
- Correlation is considered or described as the best technique for measuring and also for estimating the quantitative relationship between two variables. Correlation measures how strongly two variables are related. Given two random variables, it is the covariance between both divided by the product of the two standard deviations of the single variables, hence always between -1 and 1.
-  - Covariance is a measure that indicates the extent to which two random variables change in cycle. It explains the systematic relation between a pair of random variables, wherein changes in one variable reciprocal by a corresponding change in another variable.
- Machine Learning: Correlation and covariance
- 
Q10: What is the difference between Point Estimates and Confidence Interval?
- Point Estimation gives us a particular value as an estimate of a population parameter. Method of Moments and Maximum Likelihood estimator methods are used to derive Point Estimators for population parameters.
- A confidence interval gives us a range of values which is likely to contain the population parameter. The confidence interval is generally preferred, as it tells us how likely this interval is to contain the population parameter. This likeliness or probability is called Confidence Level or Confidence coefficient and represented by 1 − ∝, where ∝ is the level of significance.
- Machine Learning: Point Estimates and Confidence Interval
Q11: What is the goal of A/B Testing?
- It is a hypothesis testing for a randomized experiment with two variables A and B.
The goal of A/B Testing is to identify any changes to the web page to maximize or increase the outcome of interest. A/B testing is a fantastic method for figuring out the best online promotional and marketing strategies for your business. It can be used to test everything from website copy to sales emails to search ads. An example of this could be identifying the click-through rate for a banner ad.
- Machine Learning: A/B Testing?
Q12: What is p-value?
- When you perform a hypothesis test in statistics, a p-value can help you determine the strength of your results. p-value is the minimum significance level at which you can reject the null hypothesis. The lower the p-value, the more likely you reject the null hypothesis.
- Machine Learning: p-value
Q13: What do you understand by statistical power of sensitivity and how do you calculate it?
- Sensitivity is commonly used to validate the accuracy of a classifier (Logistic, SVM, Random Forest etc.). Sensitivity = [ TP / (TP +TN)]
-
- Machine Learning: statistical power of sensitivity
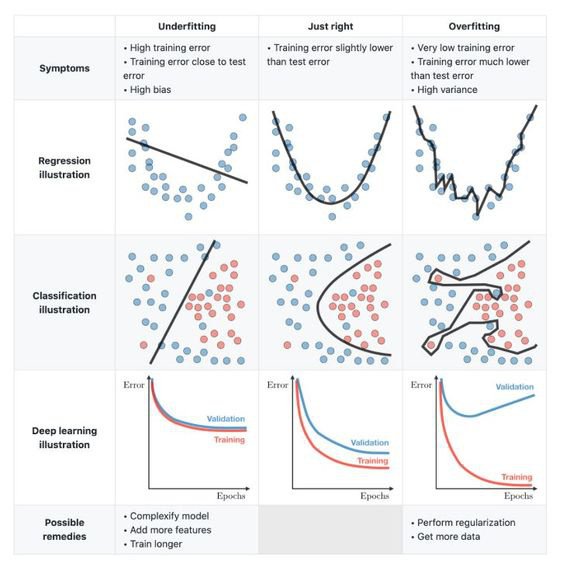
Q14: What are the differences between over-fitting and under-fitting?
- In statistics and machine learning, one of the most common tasks is to fit a model to a set of training data, so as to be able to make reliable predictions on general untrained data.
- In overfitting, a statistical model describes random error or noise instead of the underlying relationship.
Overfitting occurs when a model is excessively complex, such as having too many parameters relative to the number of observations. A model that has been overfitted, has poor predictive performance, as it overreacts to minor fluctuations in the training data.
- Underfitting occurs when a statistical model or machine learning algorithm cannot capture the underlying trend of the data. Underfitting would occur, for example, when fitting a linear model to non-linear data.
Such a model too would have poor predictive performance.
- Machine Learning: Differences between over-fitting and under-fitting?
Q15: How to combat Overfitting and Underfitting?
To combat overfitting:
1. Add noise
2. Feature selection
3. Increase training set
4. L2 (ridge) or L1 (lasso) regularization; L1 drops weights, L2 no
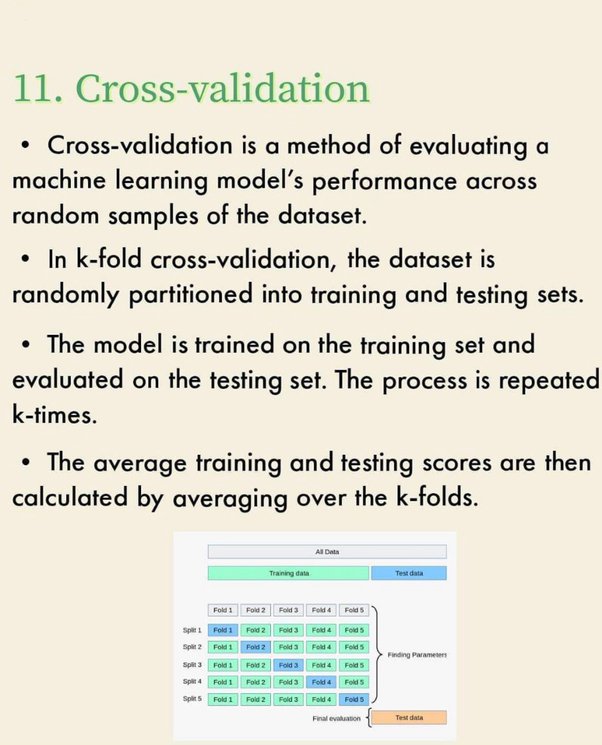
5. Use cross-validation techniques, such as k folds cross-validation
6. Boosting and bagging
7. Dropout technique
8. Perform early stopping
9. Remove inner layers
To combat underfitting:
1. Add features
2. Increase time of training
- Machine Learning: combat Overfitting and Underfitting
Q16: What is regularization? Why is it useful?
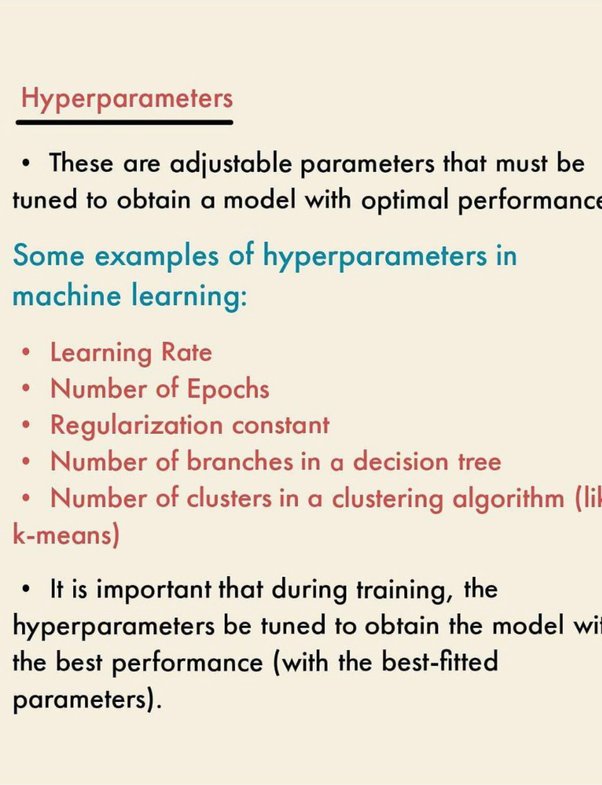
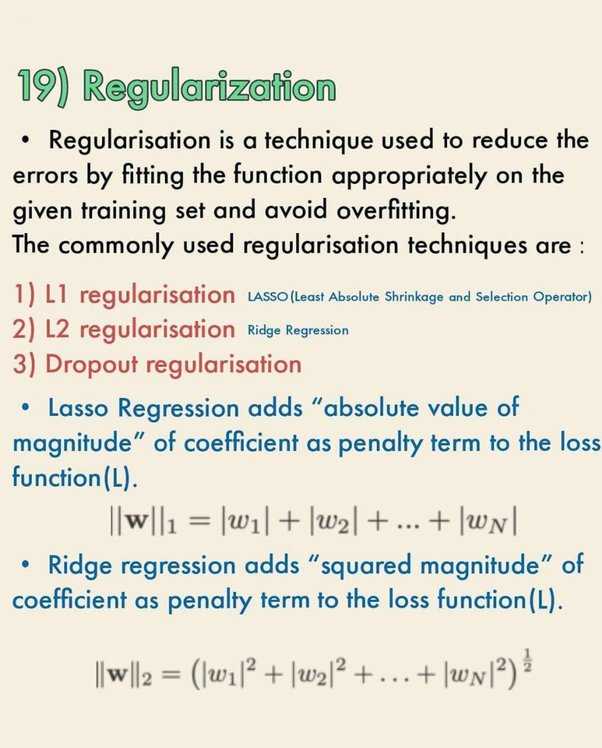
- Regularization is the process of adding tuning parameter (penalty term) to a model to induce smoothness in order to prevent overfitting. This is most often done by adding a constant multiple to an existing weight vector. This constant is often the L1 (Lasso - |∝|) or L2 (Ridge - ∝2). The model predictions should then minimize the loss function calculated on the regularized training set.
- Machine Learning: Regularization
Q17: What Is the Law of Large Numbers?
- It is a theorem that describes the result of performing the same experiment a large number of times. This theorem forms the basis of frequency-style thinking. It says that the sample means, the sample variance and the sample standard deviation converge to what they are trying to estimate. According to the law, the average of the results obtained from a large number of trials should be close to the expected value and will tend to become closer to the expected value as more trials are performed.
- Machine Learning: Law of Large Numbers?
Q18: What Are Confounding Variables?
- In statistics, a confounder is a variable that influences both the dependent variable and independent variable.
- If you are researching whether a lack of exercise leads to weight gain:
- weight gain = dependent variable
- lack of exercise = independent variable
- A confounding variable here would be any other variable that affects both of these variables, such as the age of the subject.
- Machine Learning: Confounding Variables
Q19: What is Survivorship Bias?
- It is the logical error of focusing aspects that support surviving some process and casually overlooking those that did not work because of their lack of prominence. This can lead to wrong conclusions in numerous different means. For example, during a recession you look just at the survived businesses, noting that they are performing poorly. However, they perform better than the rest, which is failed, thus being removed from the time series.
- Machine Learning: Survivorship Bias
Q20: Differentiate between univariate, bivariate and multivariate analysis.
- Univariate analyses are descriptive statistical analysis techniques which can be differentiated based on one variable involved at a given point of time. For example, the pie charts of sales based on territory involve only one variable and can the analysis can be referred to as univariate analysis.
- The bivariate analysis attempts to understand the difference between two variables at a time as in a scatterplot. For example, analyzing the volume of sale and spending can be considered as an example of bivariate analysis.
- Multivariate analysis deals with the study of more than two variables to understand the effect of variables on the responses.
- Machine Learning: univariate, bivariate and multivariate analysis
-
Q21: What’s the difference between SAS, R, And Python Programming?
- SAS is one of the most popular analytics tools
used by some of the biggest companies in the
world. It has great statistical functions and graphical
user interface. However, it is too pricey to be eagerly
adopted by smaller enterprises or individuals.
- R, on the other hand, is a robust tool for statistical
computation, graphical representation, and reporting.
The best part about R is that it is an Open Source
tool. As such, both academia and the research community use it generously and update it with the latest features for everybody to use.
- In comparison, Python is a powerful open-source
programming language. It’s intuitive to learn and
works well with most other tools and technologies.
Python has a myriad of libraries and community created modules. Its functions include statistical operation, model building and many more. The best characteristic of Python is that it is a general-purpose
programming language so it is not limited in any way.
- Machine Learning: